

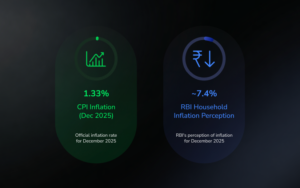
December 2025’s inflation print stopped economists cold: 1.33%. Food prices fell 2.71% year-on-year.
According to the RBI’s September 2025 household survey, consumers perceived current inflation at around 7.4%. That was not a rounding error. That was a five-times difference between government data and what people’s wallets felt.
Both numbers were real. Both were right. And that paradox got resolved.
On February 12, 2026, India released its first CPI reading under a completely new framework that slashed food’s weight from 46% to 37%, boosted housing to 18%, and fundamentally rewrote how the country measured inflation. The overhaul addressed India’s near-zero inflation, which was not economic mastery but arithmetic. Good monsoons crushed food prices, and a favorable base effect from sky-high 2024 prices made 2025 look artificially low. Without the base effect math trick, that 1.33% looked far less impressive.
This month, we decode India’s inflation paradox.
We cover:
1. How the base effect creates misleading inflation optics
2. Why households perceive 7.4% inflation when CPI shows 1.33%
3. The seismic shift coming with the 2024 base year change
4. What the 46% to 37% food weight reduction really means
5. Why housing, education, and healthcare will dominate the new CPI
6. How this reshapes monetary policy and your personal finances
1. Base Effect Illusion
Understanding base effect required stripping away economic jargon and looking at pure arithmetic. Inflation measured how much prices changed compared to the same month last year. If tomatoes cost rupees 100/kg in December 2024 and rupees 50/kg in December 2025, that registered as -50% inflation even if they were rupees 30/kg two years ago. The comparison point, the base, determined everything.
India’s late 2024 saw brutal food price spikes. Vegetables jumped, pulses surged, edible oils climbed. By December 2024, the CPI basket had absorbed substantial price increases. In December 2025, good monsoons flooded markets with produce, global commodity prices eased, and the government cut import duties strategically. Prices did not collapse; they normalized. But compared to inflated 2024 levels, the year-on-year calculation showed dramatic declines.
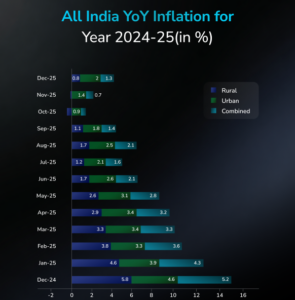
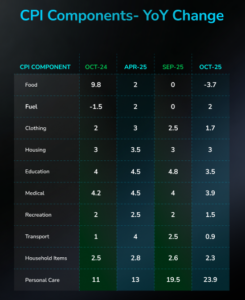
Food inflation turned negative in June 2025 and stayed there, hitting record lows of -5.02% in October before moderating to -2.71% in December. This was not deflation in the classic sense where prices fell below historical norms. This was mathematical normalization after an exceptional spike, registering as negative only because the base comparison was elevated.
The problem compounded because food dominated India’s CPI at 45.86% under the 2012 base. Food movements overwhelmed everything else. When food inflation crashed from elevated bases, headline CPI followed mechanically, regardless of rent, school fees, healthcare costs, or subscription services. The index became less a measure of actual price pressure and more a reflection of agricultural cycles and commodity volatility.
Economists called this “base effect distortion.” Policymakers acknowledged it. But households did not care about mathematical nuance; they cared that monthly expenses felt relentless even when official inflation suggested relief.
2. Household Reality
The RBI’s September 2025 household survey revealed what official statistics missed: median inflation perception stood at 7.4%, up 20 basis points from the previous round. This was not public ignorance or economic illiteracy. This was real people tracking real expenses in categories that mattered to them, and those categories told a different story than the CPI headline.
Urban rent climbed steadily across metros, with no relief for millions whose housing costs consumed 30-40% of income. Yet housing carried just 10.07% weight in the current CPI, and the rent component excluded employer-provided accommodation while focusing narrowly on market rentals, missing huge swathes of actual housing inflation from mortgages or maintenance.
Education costs surged relentlessly. Private school fees in cities jumped 8-12% annually, tuition for competitive exams became a parallel economy, and higher education abroad drained lakhs from middle-class families. The current CPI gave education just 4.46% weight under “miscellaneous,” treating it as less important than “pan, tobacco and intoxicants” at 2.38%.
Healthcare told a starker story. Medical inflation ran above headline CPI, with diagnostic tests, specialty consultations, and medicines climbing faster than official rates. Health insurance premiums jumped 30-40% in some segments. Yet healthcare accounted for just 5.89% of the basket.
The digital economy explosion added more: streaming subscriptions, cloud storage, app-based services, Uber/Ola rides, Swiggy/Zomato markups. These categories barely existed in 2011-12 when the CPI basket was designed, but they became non-negotiable for urban India. The index ignored them or captured them inadequately.
The disconnect sharpened between urban and rural experiences. Kolkata households reported 10.5% perceived inflation, Mumbai 8.5%, Delhi 8.0%. These dense urban centers saw food’s spending share fall below 40%, while housing, education, healthcare, and services dominated. A CPI built around 2011-12 patterns with 46% food weighting felt disconnected.
Younger respondents under 25 reported 7.0%, those above 60 showed 7.9%. Established households with mortgages, school-age children, and healthcare needs experienced higher effective inflation than younger earners. A single inflation number could not capture these realities, and the official number captured none well.
3. Base Year Revolution
The shift from 2012 to 2024 base marked the most significant overhaul since CPI replaced WPI as headline in 2013. This was recognition that the economy had structurally transformed and the old framework no longer fit.
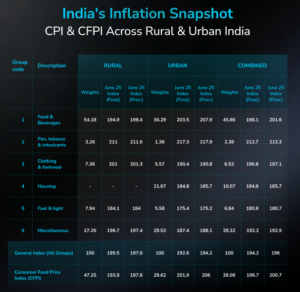
Food and beverages weight dropped from 45.86% to 36.75%, reflecting Engel’s Law as incomes rose and households spent less on food. The 2023-24 Household Consumption Expenditure Survey showed rural food share fell from 52.9% to 47.04%, urban from 42.62% to 39.68%.
Housing, water, electricity, gas, and fuels rose from 16.91% to 17.66%, with housing reconfigured more comprehensively. This included rural housing rent for the first time and shifted away from excluding employer-provided accommodation.
Transport, information, and communication nearly doubled from 8.59% to 12.41%, capturing mobility costs (ride-hailing, fuel, vehicle financing) and digital services (telecom, broadband, OTT) that barely registered in 2011-12.
Health rose from 5.89% to 6.10%, personal care/miscellaneous from 3.89% to 5.04%. Education emerged standalone at 3.33% versus 4.46% buried under miscellaneous.
The basket expanded from 299 to 358 items, adding e-commerce data from 12 online markets in cities over 25 lakh population. This recognized online price discovery during flash sales or discounts. The methodology adopted Jevons index formula, centralized collection for fuel/rail/telecom, and included rural rent.
4. Immediate Arithmetic Impact
Economists at SBI Research, Nomura, and Bank of Baroda modeled the impact: CPI rose 20-40 basis points on unchanged prices. Core inflation ran around 4.6% in December under old weights when headline was 1.33%. With food at 37%, the deflation drag diminished; housing and services above headline gained weight. Headline rose closer to core.
Nomura estimated April-December FY26 averaged 2.2% under new weights versus 1.7% actual. SBI pegged 20-30 bps, Bank of Baroda 25-40 bps. In low food inflation like late 2025, new prints were 20-30 bps higher; January 2026 confirmed at 2.75%, a jump from December. This reduced volatility.
The politically sensitive switch meant 2025’s low prints would have been higher under new methodology, validating household feelings but ending the “victory lap” narrative.
5. Monetary Policy Shift
The RBI’s MPC targeted CPI at 2-6% with 4% midpoint. Through 2025, inflation stayed below 2% for three months (October-December), raising rate cut questions. The base change fixed this: those months printed 2.5-3.0% under new weights, in the comfort zone.
Lower food weight provided relief from supply-side shocks like monsoons that monetary policy could not fix. The MPC focused on demand-driven inflation in services, rent, wages responsive to rates.
Risks included consistently higher prints toward 4.5-5.0%, tightening rate cut scope. Adoption of COICOP 2018 aligned with global standards for better comparisons and bond index inclusion.
6. Personal Finance Impact
The CPI change did not alter grocery or rent prices directly. But it reshaped policymaking, affecting rates, wages, transfers.
Higher prints adjusted real rates: savings/FDs saw lower real returns. Borrowers faced delayed RBI cuts, keeping EMIs elevated. Government DA and MGNREGA wages rose automatically.
Expectations moderated as official inflation closed the perception gap. Investors favored edtech, healthcare, premium housing; commodities lost sway. Housing gained policy attention with fuller capture.
Measurement vs. Lived Reality
India’s 2025 inflation exposed the gap between statistical precision and experience. Low official prints coexisted with 7.4% perceptions because they measured different realities. The old CPI, anchored to 2011-12, had become irrelevant.
The February 12 shift acknowledged economic evolution: less food dominance, more services/housing. It offered policymakers clarity, less volatility, better alignment. Households saw gradual recalibration in wages, rates, indexation.
The paradox was not sustainable. India fixed the measurement, converging closer to reality, January’s 2.75% showed it.
Disclaimer
This article is for informational purposes only and does not constitute financial or investment advice. Data is sourced from Ministry of Statistics and Programme Implementation, Reserve Bank of India, and various financial research reports. Economic conditions and policy frameworks may change. Readers should consult qualified financial advisors before making decisions based on inflation trends or monetary policy expectations. Past economic patterns do not guarantee future outcomes.